


Software development is often associated with leading technology and a high level of knowledge in developers. Many clients are trying to create projects that have never existed before. However, every software development project can be affected by unforeseen events that might be leading to failure.
What is risk management in software engineering? Software development project risk management is the process of identifying possible negative events and actions to prevent them or minimize the impact should they occur. A clear understanding and awareness of potential risks along with attempts to minimize their impact are vital to completing a software development project.
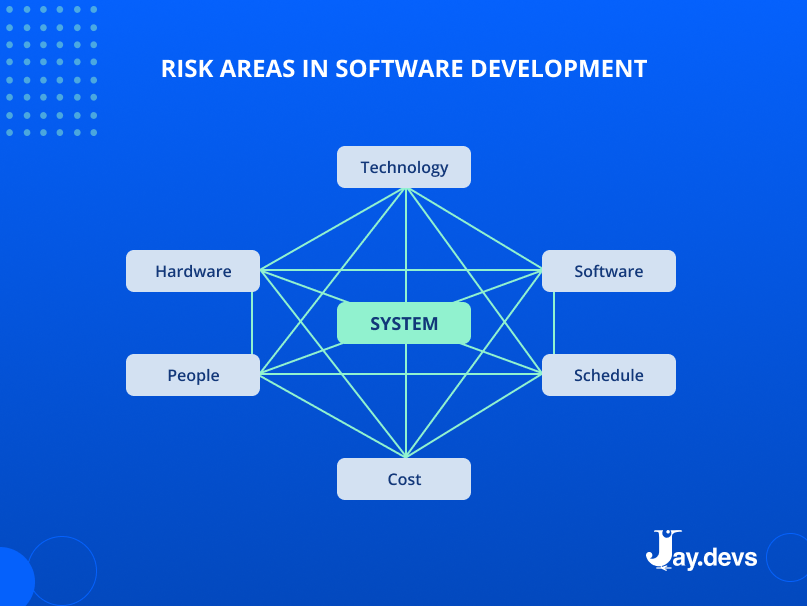
All areas of development are potential sources of risk. They can be related to technology, hardware, software, development team, cost, and timeline.
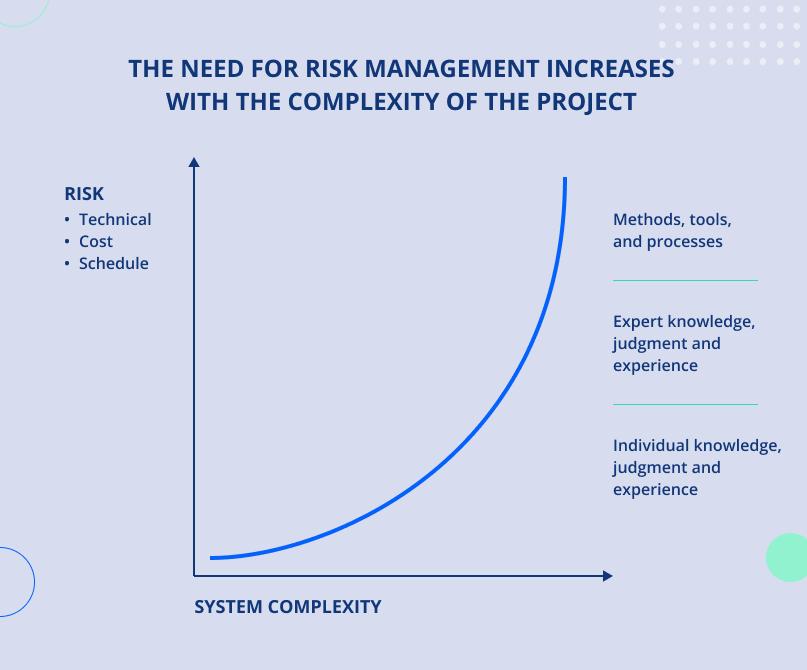
The need for risk management increases with the complexity of your project. As complexity grows, both technical and non-technical (cost and schedule) risk increases. At the same time, it requires more serious methods and tools to manage risks.
Many issues arising during the project are risks that have been ignored. However, even simple methods can help identify and minify risks.
The purpose of the article is to help project leaders, managers, and CTOs to:
- manage risks
- make more effective and informed decisions by revealing risks before they turn into issues
- eliminate risks with the development team in a cost-effective manner
1. Risk identification
Identification is the process of describing and measurement of all potential project issues.
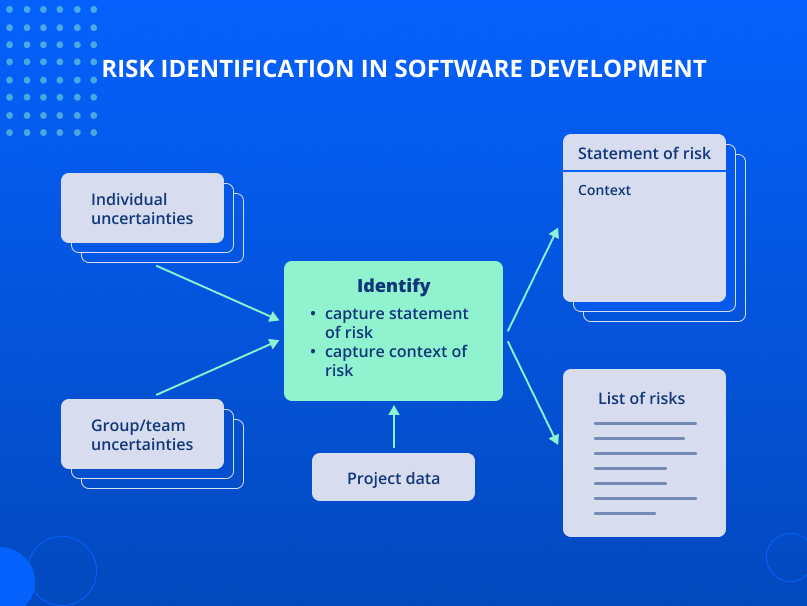
Core elements:
- Individual uncertainties—doubts of certain people regarding the project and its implementation.
- Group/team uncertainties—group exchange of several standpoints about the project and its implementation.
- Project data—information about the project: project budget and timeline, critical path, and performance indicators.
- Context of risk—detailed description and context of risks.
- Lists of risks—list of all data ion risks revealed for a project.
Identification techniques and tools
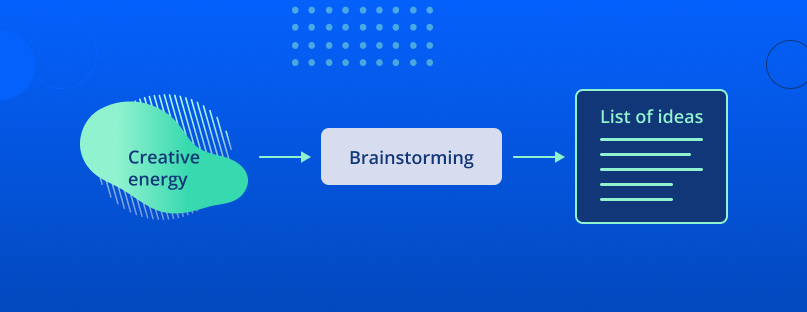
Brainstorming
Brainstorming is a group method of generating ideas.
This technique:
- demonstrates the best performance in small groups (less than nine members)
- requires an experienced facilitator. A facilitator is a person managing a group event creating successful communication between team members
Course of action:
1. A facilitator presents a problem or a risk to address and generate potential ideas for solving.
2. A facilitator explains the rules. For instance:
- Don’t judge or criticize the speaker’s ideas.
- Encourage bold ideas or out-of-the-box thinking.
- Develop the ideas of other group members.
- Generate a great number of ideas.
- Enjoy the process.
3. Generate ideas. Ideas are generated by the members of the group applying one of the below methods:
- unstructured: spontaneous expression of ideas
- round-robin: everyone takes turns talking about their ideas
4. A facilitator presents generated ideas by applying visual means for clear understanding and reference (flip chart, whiteboard, sticky notes, etc.).
5. Review list. All members review the list for clarity and shared understanding.
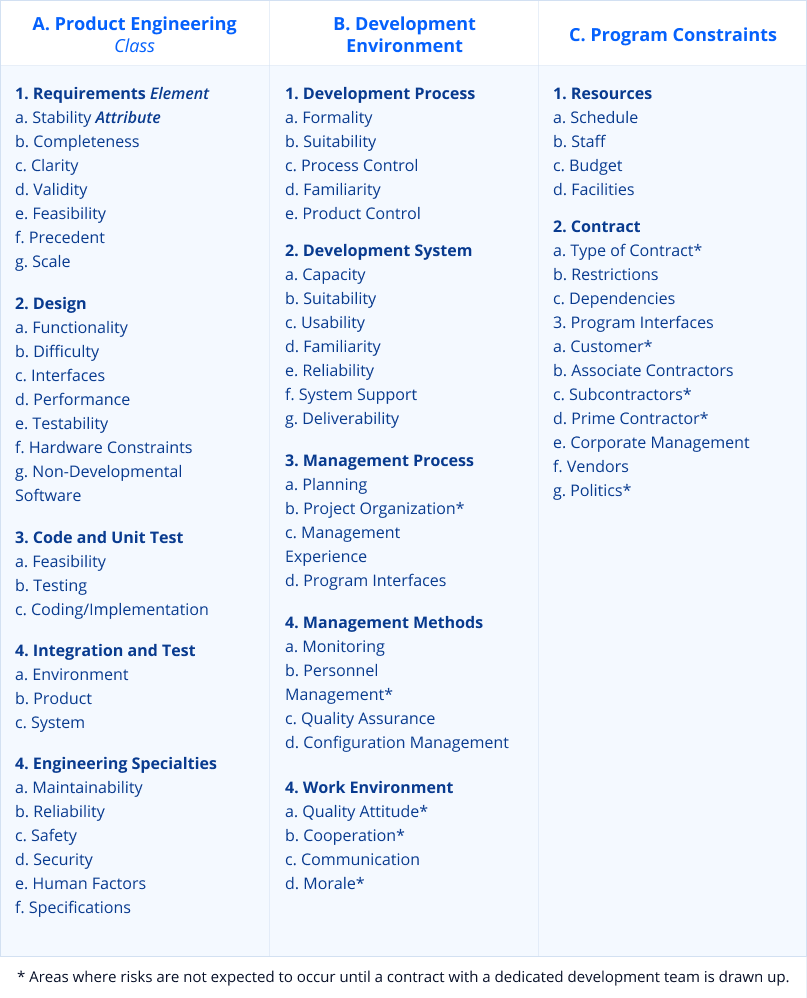
Taxonomy Classification
The taxonomy is the completion of a questionnaire—a list of questions to identify potential risks in all the fields of the development process. It ensures that all potential unforeseen project issues are systematically considered.
Taxonomy is carried out by interviewing all persons involved in the project: engineers, testers, customers, and other stakeholders.
Software taxonomy is divided into three main classes:
- product development: technical aspects of work in progress
- development environment: methods, procedures, and tools applied to create the product
- factors beyond the project control: contractual, organizational, and operational
These taxonomy classes are further divided into elements, where each element has its own attributes. Each attribute should be evaluated in terms of impact and likelihood of occurrence. Finally, the five most essential project risks are selected.
The taxonomy risk identification process helps to reveal and clarify the issues for the technical and managerial project members.
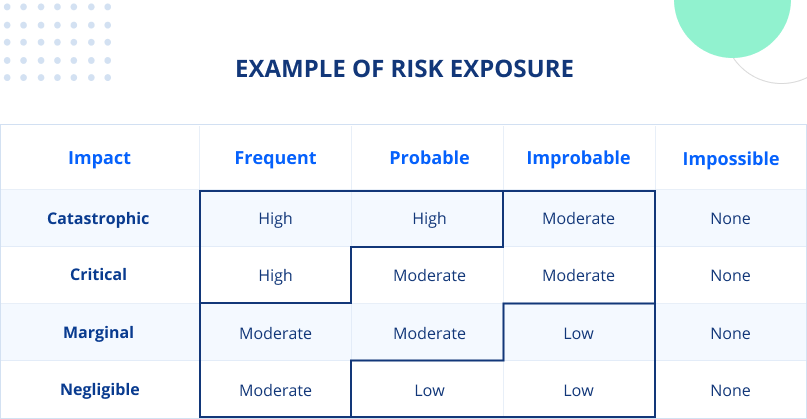
Further, complete the analytical part: define the risk as catastrophic, critical, secondary, or insignificant. Note that insignificant risks do not mean “zero-project impact”. Too many insignificant risks can have serious consequences for your project.
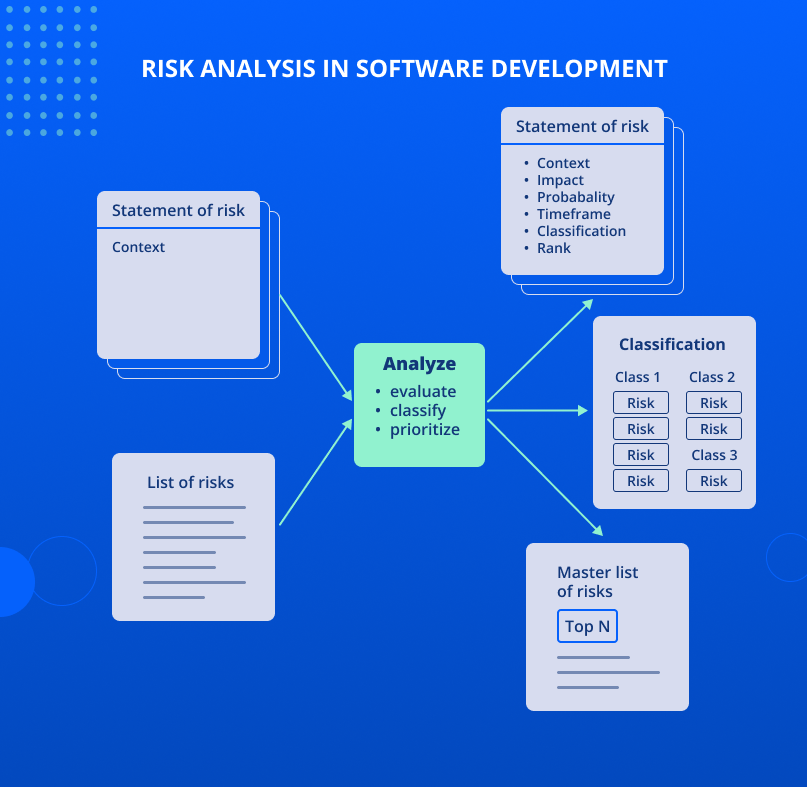
2. Risk analysis
Analysis—determines what is crucial for the project and helps to prioritize risk elimination.
Core elements:
- List of risks—risks listed for further analysis.
- Statement of risk (input)—describe the context of every risk before analyzing them.
- Statement of risk (output)—after analyzing the impact, probability, time frame, classification, and rank, present actualized information for each risk.
- Classification—risk grouping.
- Master list of risks—write down all identified risks along with prioritized N risks.
Analytical methods and tools
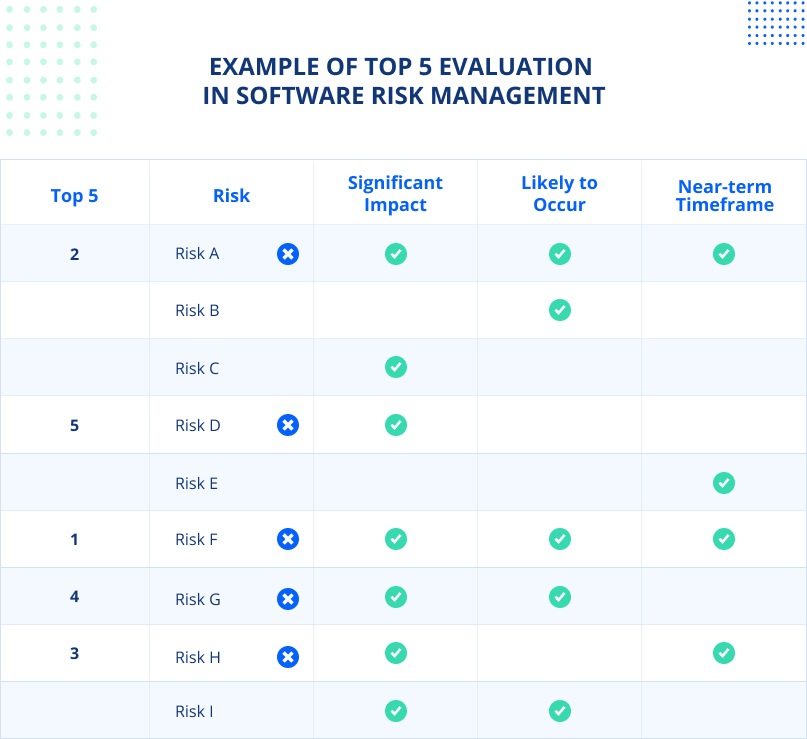
Top5 Evaluation
Top 5 evaluation: the essence of this method is to choose the 5 most dangerous risks in the opinion of every team member. The goal is to get and summarize the individual points of view of every team member on what is essential for the project.
The course of action for every project member to evaluate the Top 5 risks:
1. Analysis of the risk, its context, and its attributes.
Attribute values:
a. Impact: project loss or impact
b. Likelihood: the likelihood of risk
c. Time frame: the period when action to reduce risk is required
2. Select the most essential risks. If the list contains more than 5 risks, they should be compared, and the list should be shortened.
3. Compare five major risks and prioritize them from one to five, where one is the most crucial project risk.
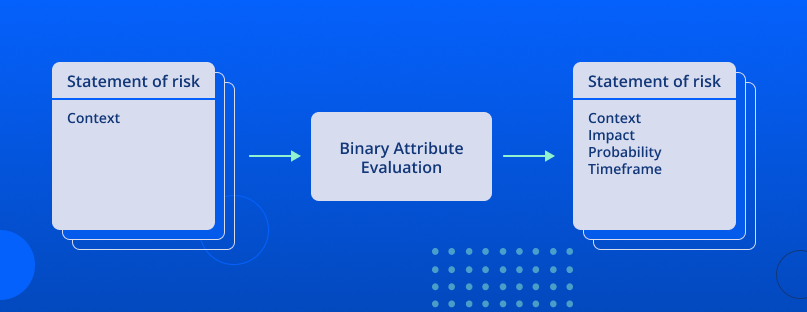
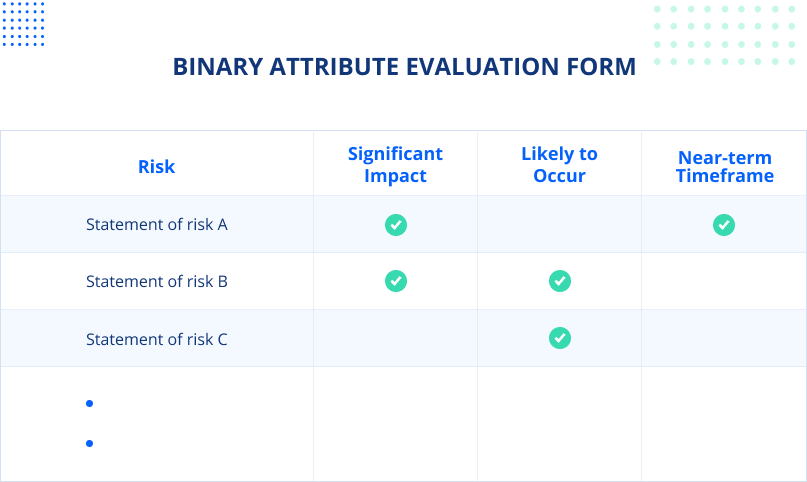
Binary Attribute Evaluation
A Binary Attribute is a technique to evaluate the impact, likelihood, and time frame of a risk. Attribute values for each risk are determined based on specific answers to the questions.
- Impact: significant or insignificant.
The risk is significant if the impact seriously disrupts the process, degrades the quality of the product, or jeopardizes the success of the project.
- Likelihood: likely or unlikely; the risk is more likely than not.
- Time frame: short term or long term; a risk is short-term if action is needed to address it in the nearest future.
Course of action:
1. Review the risks. Make sure you have a clear understanding of the risk and its context.
2. Make sure you can rate the risks on the following criteria:
- significance of impact
- probability
- time frame
3. Assess risk impact. Mark risk impact as significant if the answer to any of the following questions is positive.
- Will the user feel the impact of this risk on the performance of your project? Its features and quality?
- Will the risk affect the project budget or timeline?
4. Assess the likelihood of risk. Rate the risk as “more likely to happen” if the answer to any of the following questions is yes.
- Has a similar risk ever occurred?
- Are there circumstances when this risk is more likely to occur rather than not possible?
5. Assess the time frame of the risk. If the answer to any of the following questions is yes, then the risks are short-term and should be addressed as soon as possible.
- Will software development start soon?
- Will addressing the risk take a long time?
- Do you expect the project release in the nearest future?
6. Repeat steps 3-5 for every consequential risk.
3. Risk planning
Planning transforms information about risks into decisions and implementation of actions to eliminate risks (both in the present and in the future).
Planning answers the following questions.
- Who owns the risk? (responsibility)
- What can I do? (approach)
- What should I do? (how much and what?—amount and actions)
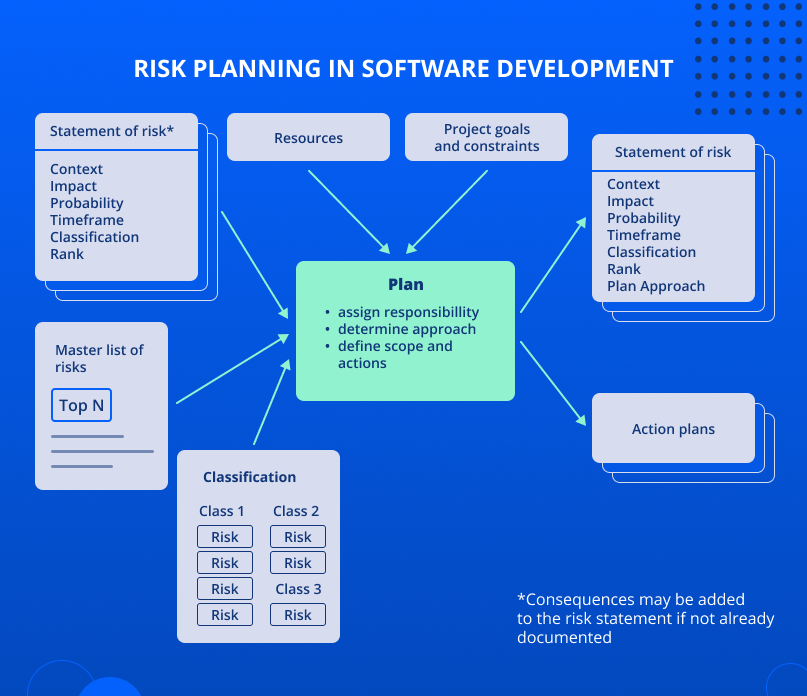
Core elements:
1. Project goals and constraints. They are defined by the development team or the client.
For instance:
- Not to break deadlines.
- Use no more than 10% of the budget on risk mitigation.
2. Resources—available resources to mitigate and observe risks.
3. Master list of risks — select the main risks.
4. Statement of risk* (input)—information on every risk. It includes risk description, impact significance, likelihood, time frames, class, and rank.
5. Classification—organization of risks as per their classification. Classification demonstrates bounds between the risks.
6. Action plans—description of actions to be undertaken regarding the risk(s). Risk action plans:
- Research;
- Observe;
- Accept;
- Eliminate.
7. Statement of Risk (output) – updated information on risks in order to outline a specific action plan:
- Research. Do you know enough about the risk? If not, explore it until you know how to address it (observe, accept, or eliminate).
- Accept. Can you stand the consequences in case the risk occurs? Can the risk be minimized more effectively later? If the answers are yes, don’t waste time and resources addressing it and simply accept it.
- Eliminate. If the risk cannot be accepted, what actions should you take to eliminate it? Create and apply the risk mitigation plan.
- Observe. If the risk cannot be accepted and eliminated immediately, then just observe it.
Planning techniques and tools
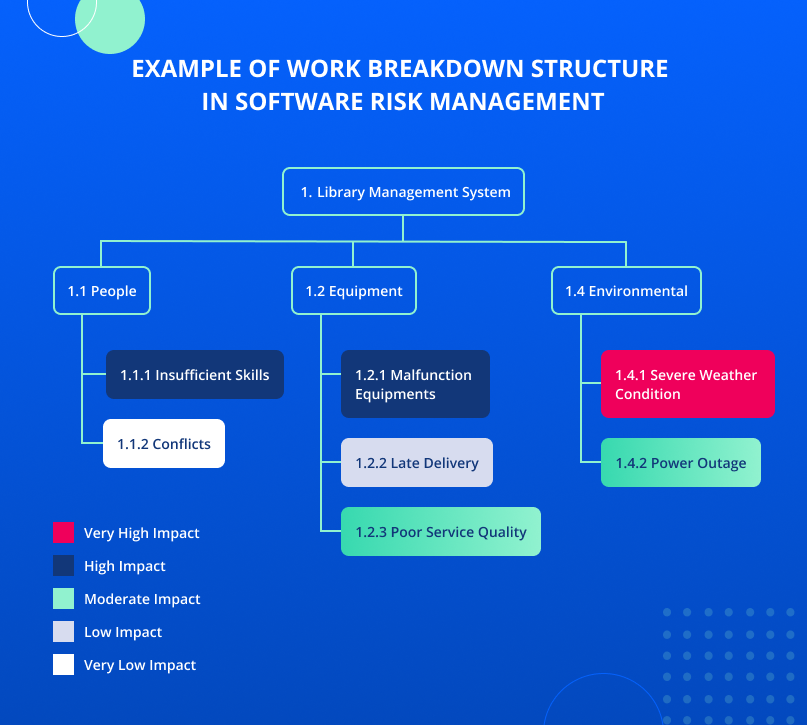
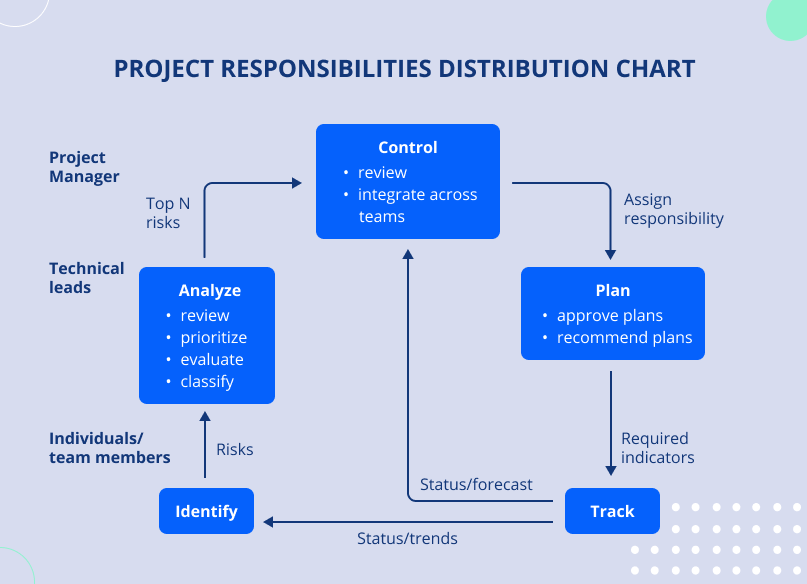
Project responsibilities distribution chart
Duties distribution structure – decomposes the project into several small tasks. Project goals reflect their relationship with each other and with the project in general. Color codes can also be applied to distribution to show the impact of the risk. Ideally, the customers (regardless of whether they are external or internal) and the entire development team are involved in the development of the Work Breakdown Structure (WBS).
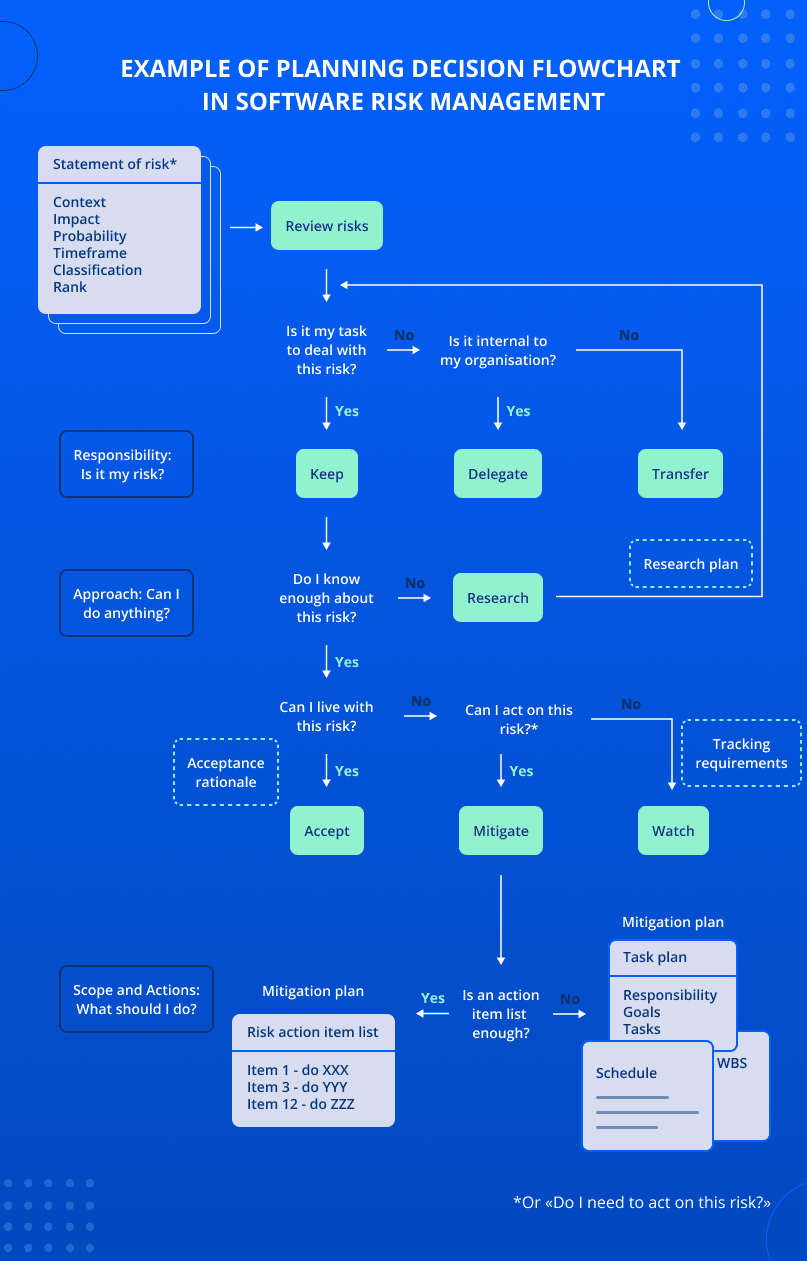
Planning Decision Flowchart
The Planning Decision Flowchart presents the actions to be taken to address the risk(s).
Follow the chart—ask yourself questions about potential risks and make decisions accordingly.
4. Risk tracking
Tracking is the process of risk monitoring and outcomes data collecting. The reports generated at this stage aid the team to take risk management decisions.
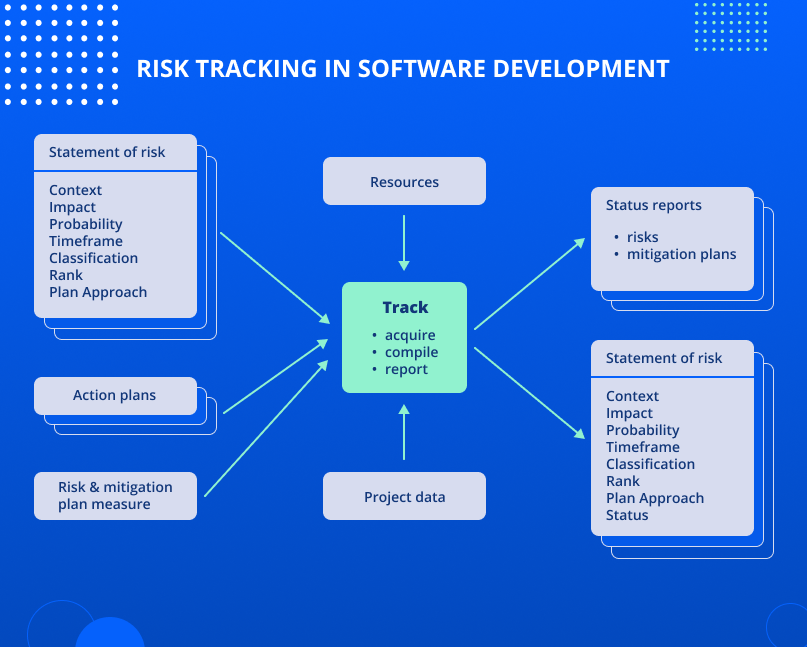
Core elements:
1. Statement of risk (input)—Before tracking, describe the risk: its context, impact, likelihood, time frame, class, rank, and plan-based approach.
2. Action plans—describe actions to be taken to eliminate the risk. They also define measures and triggers to track action plans, risks status, and elimination progress.
3. Risk and mitigation plan measure—the current status of all observed risks.
4. Resources—available resources to minimize risks.
5. Project data—information about the project. It includes the project schedule and budget, critical path, and performance indicators.
6. Status reports—reports on the status of current risks and action plans.
7. Statement of risk (output)—updated information on every risk. It includes content, impact, likelihood, time frame, classification, rank, planned approach, and risk state data.
Tracking techniques and tools
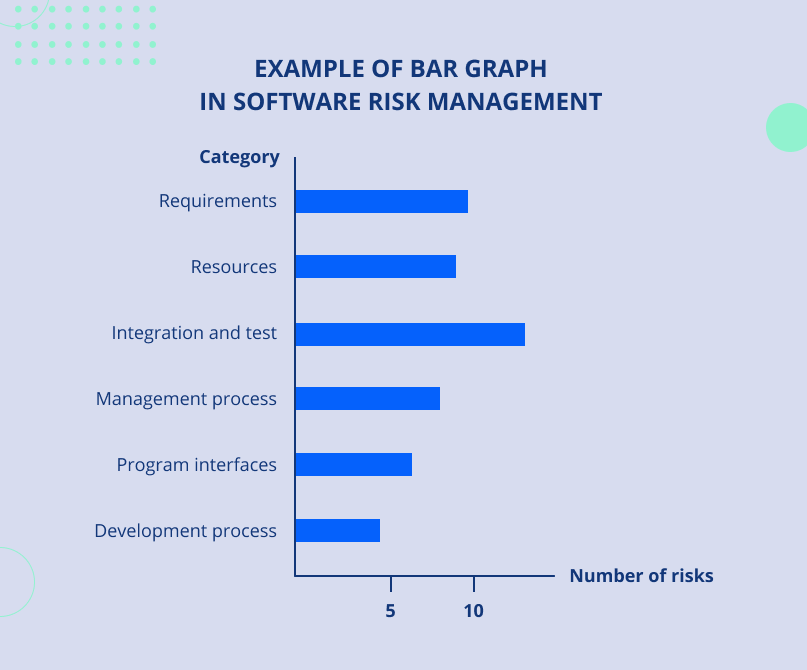
Bar Graph
A Bar Graph is used for graphical representation of risk categories and the number of risks in each category.
Category examples: requirements, resources, integration and testing, management process, APIs, development process. Column length is proportional to the number of risks.
This is a convenient method to present large data amount difficult to track when presented in a spreadsheet form. Risks are grouped by similarity into categories. Categories are displayed graphically for risk tracking and control.
Example: While tracking the risks, a CTO studied the Bar Graph and noticed that there are more than 10 risks associated with project testing. Since software development had not yet begun, he decided to send testers for additional training. This made it possible to subsequently minimize the risk in this category.
Stoplight Chart
The diagram shows the status of the risk action plan applying color codes. As a rule, these colors are red, green, and yellow.
Every plan has one of the following statuses:
- Green—no issues. Shows that everything is working according to plan. No action by technical specialists is required.
- Yellow—potential risks. Demonstrates that not everything works according to plan. At this point, technical experts’ involvement is not required, however, might be needed in the future.
- Red—major risks. Indicates that the plan is not working. Technical specialists should urgently take action.
Color codes can be set based on preferences. However, they should be set from inception and be clear for all the parties involved in software development.
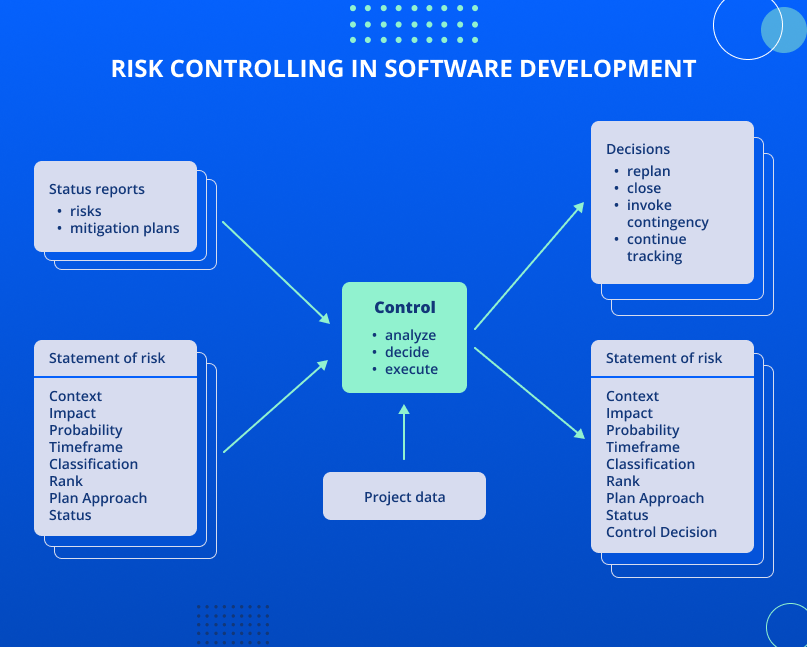
5. Risk decision making
Decision making is the process of deciding how observed risks should be addressed. The purpose of this is to make timely and effective risk decisions.
The general decision making process includes:
- Status report analysis.
- Making decisions on further actions.
- Decision execution.
Core elements:
1. Status reports – information on current risks and mitigation action plans.
2. Statement of risk (input) – before making a decision for each risk, a risk description is made: context, impact, likelihood, time frame, the class, rank, approach provided by the plan, and risk status.
3. Project data – information about the project. It includes the project schedule and budget, critical path, and performance indicators.
4. Decisions – a decision that determines the next action for the considered risk or set of risks. There are four possible decisions:
- reschedule
- risk closure
- use contingency plan
- keep on tracking
5. Statement of risk (output) – after solution implementation information about each risk is updated.
Tracking techniques and tools
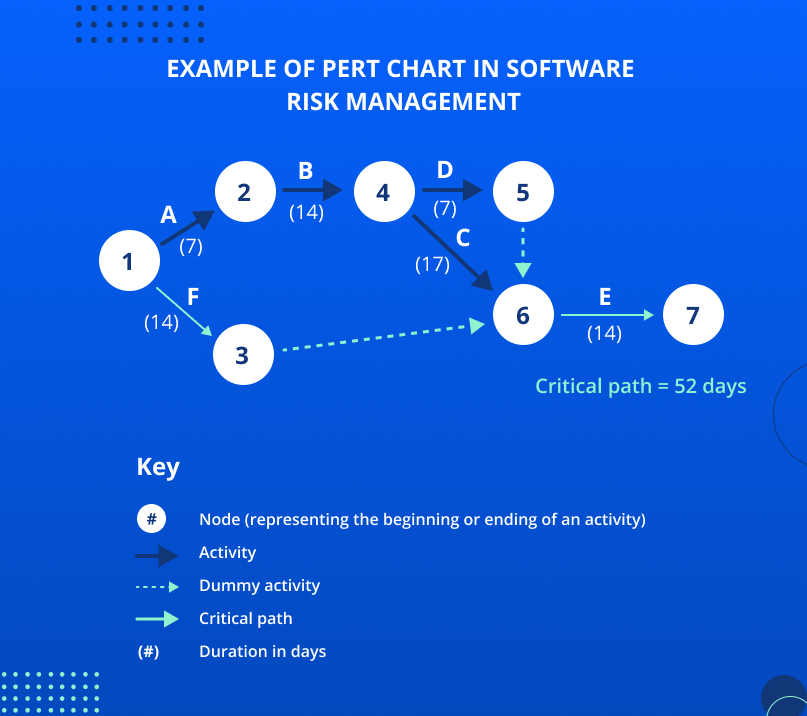
PERT Charts
PERT chart is a time and cost management tool. In project management, PERT is almost always used in conjunction with the Critical Path Method. You can read more about this and other techniques in our article “The Best Software Development Methodologies in 2022”.
A minimum that a PERT chart should demonstrate should include:
- sequence of actions and their interrelationships
- duration of each action
- the time required to complete the project (i.e., the critical path)
Depending on the complexity of the project, it might be helpful to analyze:
- the earliest expected start and end times for all activities
- the latest expected start and end times for all activities
- available time frames
The figure below demonstrates how a PERT chart works.
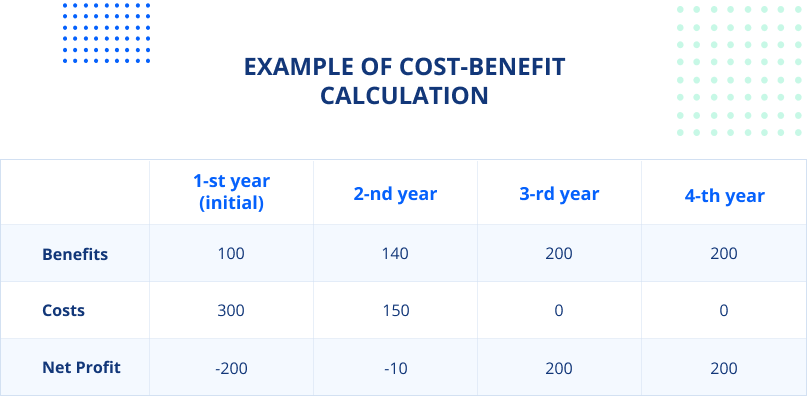
Cost-Benefit Analysis
Cost-Benefit Analysis is a method of comparing total costs and profit. Apply this method to assess and pick one of the strategies or a set of actions based on the project profitability.
Course of action:
1. Participants identify and estimate costs (which may result in cost). Estimates can be presented as a summary or periodic (for example, costs per month, year, etc.).
2. Participants determine and evaluate benefits.
3. Participants review the cost and benefit estimates for completeness and accuracy.
Cost-benefit analysis is calculated = total monetary value of benefit / total monetary value of costs.
Application of Cost-Benefit Analysis in risk management:
Example:
Risk. Your project development has lost motivation which may result in:
- Missed deadlines.
- Work performance decrease.
- Many bugs in the final product.
Strategy. «Improve developers’ morale».
Making a decision applying the Cost-Benefit Analysis technique. The developer’s morale improvement sounds quite vague. However, having a measurable objective of decreasing employee turnover by 50% enables us to have a detailed set of actions and metrics. For instance:
- Add a 5% bonus.
- Exclude work over weekends.
6. Risk communication
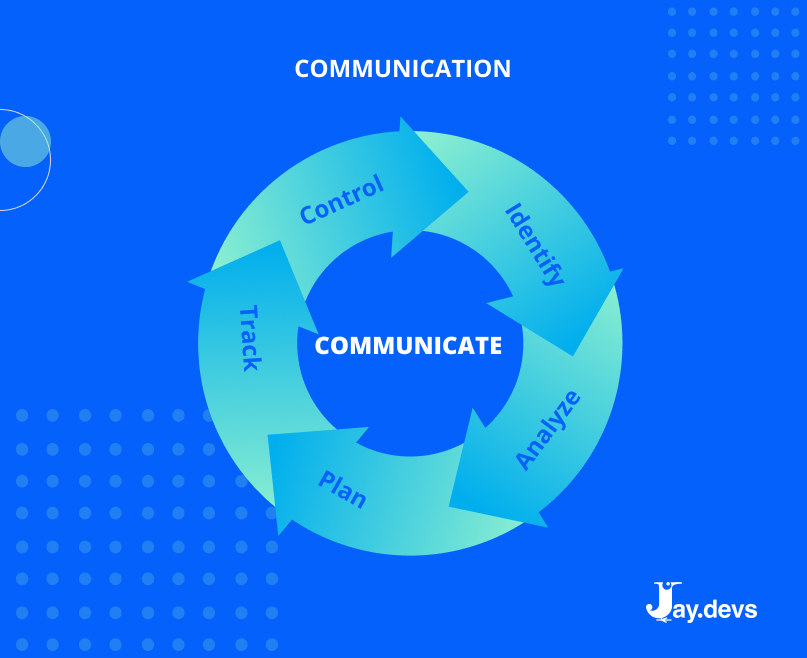
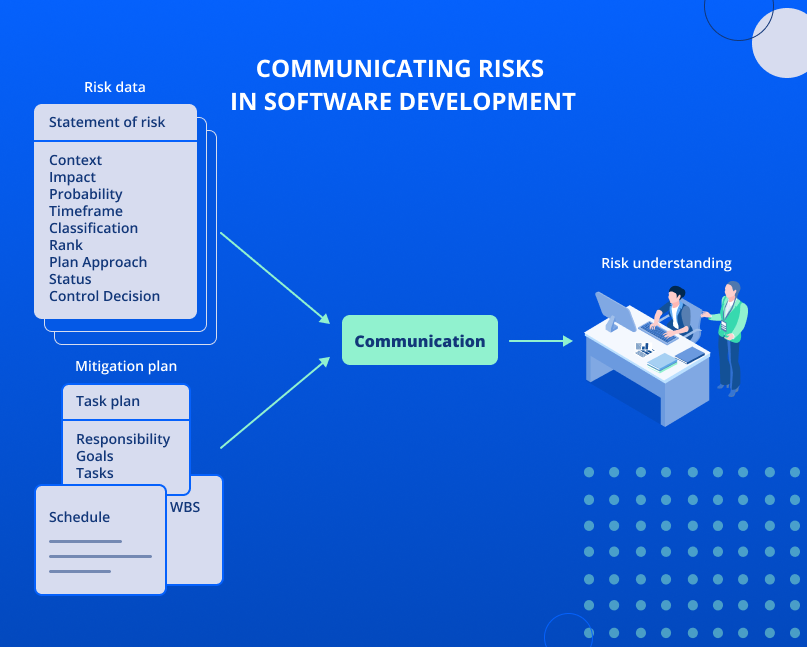
Communication is at the center of risk management. This is the channel all the previously mentioned processes pass through. Oftentimes, it becomes the biggest obstacle to risk management.
Risk communication is challenging since it is linked with two topics people usually don’t have a clear understanding of: the likelihood and negative consequences.
The purpose of communication is to understand the risks of the project and possible alternatives to prevent or mitigate them.
Sustainable internal communication provides a solid basis for risk communication.
Criteria of “good” communication should include:
- frankness
- focus on certain issues
- enough information to describe and solve the issue
- proper organization (for instance, the summary should be available for people not interested in details)
- trustworthiness.
More often, all risk elimination-related communication takes place during the weekly project meeting. The following diagram presents the roles to be responsible for specific risk management tasks.
Last few words
The success of your project implementation is largely determined by:
- revealing all potential risks
- assessment of their potential project impact
- application of techniques to mitigate the impact of these risks
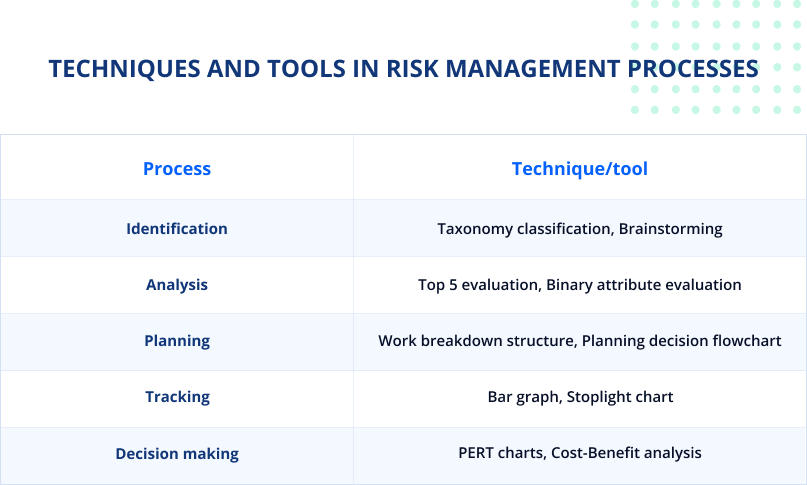
Risk management in software development is an ongoing process. Thanks to this article, you figure out what processes to follow, and what techniques and tools might be applied:
Ability to identify and correctly assess risks will:
- save your money, time, and valuable resources
- increase confidence in the goals and objectives of your software development project
- improve the security of your software development project.
Scale your team with premium-class remote developers with 5+ years of experience and the expertise you require.
Let's Talk